- About Us
- Publications
- ADPC Academy
-
MediaADPC'S NEWS
Assessing potential loss and damage for flood hazard using an econometric modelling technique Assessing potential loss and damage for flood hazard using an econometric modelling technique
23 Apr 2021
Bangkok, Thailand
The original article was published on the APN Science Bulletin on 19 April 2021. Click here to view the original article.
By Senaka Basnayake , Mehmet Ulubasoglu, Muhammad Habibur Rahman, Sarath Premalal, Lalith Chandrapala, Madan Lall Shrestha, Susantha Jayasinghe, and Niladri Gupta.
Abstract:
Agriculture production largely depends on weather conditions and is extremely prone to natural hazards. A more frequent and severe occurrence of natural hazards such as storms and floods has put food security at increased risk in recent decades. Evaluating the true impact (loss and damage) of disaster in the agriculture sector is very challenging. The present study focuses on using a randomized field experimental approach at both district and micro agricultural-plot levels to investigate the impact of floods on agricultural yields in Sri Lanka and its effect on farmers who are averse to taking risks and those who are willing to take risks. A detailed site selection technique has been used in the study. The dissimilarity in difference estimates indicates that flood-affected households have experienced the loss of paddy and non-paddy crops. However, the net loss of non-paddy is higher than that in paddy. Farmers offset this loss by expanding crop cultivated areas zthat utilize soaked fields after the flood, though there are risks of pest attack and diseases. The results are not driven by household-specific characteristics and are robust to several specifications, different crop types and alternative flood-severity measures.
KEYWORDS: Econometric modelling � Flood hazard � Loss and damage � Yield loss
Highlights:
- The study investigated the effect of floods on agriculture production and farmers’ coping mechanisms to loss.
- An econometric model is a robust method to assess loss and damage in different flood incidents and at different intensities.
- The study utilized micro-plot level data to understand the actual effect of flood hazard on farmers’ livelihoods.
1. INTRODUCTION:Climate change is inevitable and impacts critical functions that are vulnerable to climate change, such as the agriculture and water sectors. Recent studies revealed that, due to climate change, the world is moving towards scenarios of either too much or too little water. Agriculture is an open system and provides livelihoods for 60% of the world’s population. Eighty-six percent (86%) of production loss in Asia’s agriculture sector is due to floods (FAO, 2017). More than 2.2 billion people depend on agriculture for their livelihoods in Asia (ADB, 2009). Thus, climate-induced natural hazards, especially floods, are likely to considerably affect the agriculture sector and the livelihoods of the dependent population.
Due to the distinct climatic variability across the Asian continent and its geophysical setting, most countries on the Asian continent are subject to natural disasters. The frequency of these extreme events, especially the hydro-meteorological events, has shown an increasing trend (Thomas & L�pez, 2015). Amongst various hydro-meteorological hazards, flood hazards are one of the consequences of climate change-induced extreme events. Considering the effects of climate change-induced floods, South Asia is one of the world’s most vulnerable regions to floods (Mirza, 2011). Floods frequently occur in these places, which were hit by higher monsoon precipitation levels. They can cause significant damages to animal and human lives, property, crops and infrastructure. The frequency, magnitude and extent of extreme floods have been increasing in South Asian countries. In the context of cropping patterns, Asia accounts for more than 80% of global rice production (Sekhar, 2018). Therefore, flooding during the monsoon season can cause major damage to crop yields, especially rice, which may have secondary implications on several socio-economic indicators, including food security of vulnerable groups and public health in the flood plains.
From a disaster management perspective post-disaster evaluation is carried out for damage and loss, while from a climate change adaptation perspective, evaluation or assessment is carried out of loss and damage. The basic difference between the two is the former looks into estimating the damage to economic and social infrastructure, human lives etc. (McKenzie, Prasad, & Kaloumaira, 2005), focussing on the strategic impacts immediately after a disaster strikes, while the latter focusses on the potential of loss of economic flow and possible damage to life and property that may occur in areas vulnerable to disasters (OML Center, 2017). In both cases, evaluation for the agriculture sector is very challenging. Damage in the agriculture sector accounts for the effects on standing crop, farm machinery, irrigation systems, livestock shelters, fishing vessels, pens and ponds and the economic cost to replace or repair. On the other hand, loss, is caused by changes in economic flow arising out of the decline in crop production, decline in income from livestock product, increase of input prices, reduction in overall agriculture revenue and unexpected immediate needs in post-disaster events (Conforti, Markova, & Tochkov, 2020). Most of the studies or methodology developed so far for the agriculture sector concentrates on post-disaster damage and loss evaluation. One of the recent FAO methodologies looks into damage and loss to production and damage to assets. However, it has some boundary conditions (Conforti et al., 2020) and applicable to post-disaster events. The methodology considers damage and loss to all the components of the agriculture landscape and looks into damage into annual and perennial crops. A number of other studies mainly carried out in Europe looked into damage functions for agriculture within the framework of an economic appraisal of flood management projects. However, the methods have concentrated mainly towards damage to crops and less towards assets (Br�mond, Grelot, & Agenais, 2013). Some remote-based studies also evaluate post-disaster damage and loss to the agriculture sector (Jin, Xiao, Dong, Qin, & Wang, 2016; Ahmed, Rahman, Kok, & Hassan, 2017; Shrestha et al., 2017; Singha, Wu & Zhang, 2017; Torbick, Chowdhury, Salas, & Qi, 2017).
The present study aims to test the econometric methodology for estimating loss and damage due to floods in the agricultural sector to strengthen early warning systems for floods and improve the methodology for flood risk assessment considering climate change. The present study is part of research conducted in three countries in Asia, namely Sri Lanka, Nepal and Thailand. The paper presents the outcome of the study carried out in Sri Lanka. The key objective of this study is to investigate the effect of floods on agriculture production and how farmers cope with the losses caused by floods.
1.1 Study area background
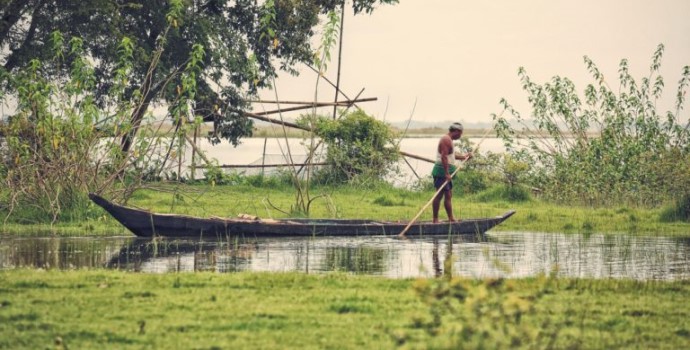
Sri Lanka is an island located at the tip of the Indian sub-continent surrounded by the Indian Ocean. 77.4% of the Sri Lanka rural population of Sri Lanka depends on agriculture as their major livelihood option (Marambe, Silva, & Athauda, 2017) and are frequently hit by natural disasters. Sri Lanka has seen a steady rise in the frequency of floods over the past two decades (IWMI, 2018). Flood occurrence in Sri Lanka is almost regular in the recent decade (every year over the last ten years), with an apparent increase in the affected areas. Based on observation, on average, fewer than five districts were affected by floods during the period 1991 to 2000, which doubles in the last decade. Studies on the effect of floods on agricultural production in Sri Lanka is limited. Thus, understanding the effect of floods on agricultural production and how farmers respond to the losses caused by floods is vital for policy-makers and government institutions. The uniqueness of the present study is that it utilizes natural field experiment data at a micro-plot level that is less likely to be disturbed by other factors, allowing identification of the hazard’s actual effect on the farmers’ livelihood.
2. METHODOLOGY
2.1 Flood hazard zonation
To develop a comprehensive flood model, accurate topographic data with all land use, elevations, stream cross-sections, dimensions, and stream network levels are necessary. However, during data collection, it was found that most of the required data set was not available. Thus, instead of a flood hazard mapping of the individual districts, we considered the plot-wise water level to measure severity. For the study, we employed a water surface elevation calculation method recommended by FEMA (2018). This method calculates flood-water height at a resolution of 0.0002 arc degrees (i.e. around 22 meters) using earth surface elevation data sourced from ASTER Global Digital Elevation Model Version 2 (GDEM v2) and the flood inundation extent map available from the Disaster Management Centre, Government of Sri Lanka.
2.2 Future precipitation projection
Future climate change scenarios can play a vital role in preventing and mitigating hydro-meteorological disasters (Islam et al., 2008). The data generated by climate models can be used as inputs for a number of physical, hydrological and agricultural models to predict future climate change impacts. Using these models, policy-makers can better develop evidence-based and rigorous strategies and reduce the impact of these disasters on communities (Stainforth et al., 2007).
A thorough review was conducted to acquire future climate change data with an acceptable horizontal resolution to analyze future precipitation projection of Sri Lanka. NASA Earth Exchange (NEX) models, which have future climate change scenarios from 21 Global Circulation Models (GMCs) under two emission scenarios (RCP 4.5 and 8.5) with 25 x 25 km2 resolution were identified. The NASA Earth Exchange Global Daily Downscaled Projections (NEX-GDDP) dataset comprised of downscaled climate scenarios for the globe were derived from the General Circulation Model (GCM) runs conducted under the Coupled Model Inter-comparison Project Phase 5 (CMIP5) (Taylor, Stouffer, & Meehl, 2012) and across two of the four greenhouse gas emissions scenarios known as Representative Concentration Pathways (RCPs) (Meinshausen et al., 2011). Out of the NASA Earth Exchange (NEX) 21 models (CMIP5 models) with RCP4.5 and RCP8.5 emission scenarios, 12 GCMs were found to be suitable for understanding future change of annual mean temperature (∆T) and percentage (%) chance of annual precipitation (∆P%) over South Asia and especially Sri Lanka. As the present study dealt with flood, identifying extreme wettest events in the future was important. The models closest to the 10th and 90th percentile of the change of annual mean temperature (∆T) and % change of annual precipitation (∆P%) during the 2030s, 2050s and 2080s in the two RCPs were considered for the study as they represent extreme conditions. The plots of projected changes in annual average temperature and precipitation by 2080 are given in Figure 1.
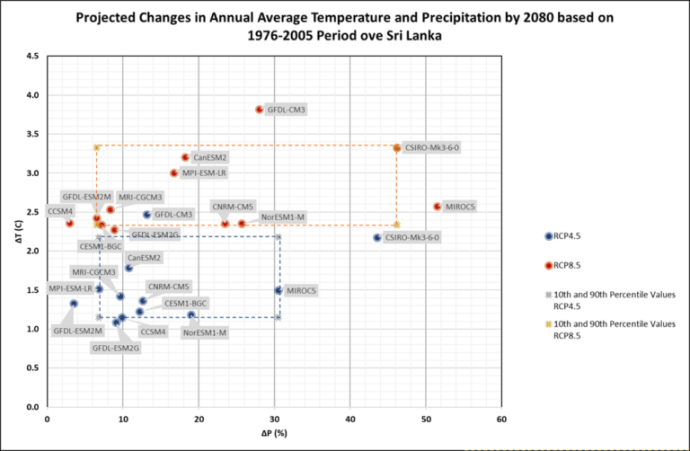
FIGURE 1. Identification of model depicting the extreme projected annual average temperature and precipitation by 2080 over Sri Lanka (10th and 90th percentile).
A similar analysis to identify the suitable model depicting the wettest/hottest extreme for the northeast monsoon season and south-west monsoon season for 2080 time period as well annual, south-west monsoon season and north-east monsoon season for 2030 and 2050 time period was carried out. The three-time periods’ analysis results identified that the CSIRO-Mk3-6-0 model shows extreme conditions (wettest/hottest) over Sri Lanka during all time horizons with RCP4.5 and RCP8.5 scenarios.
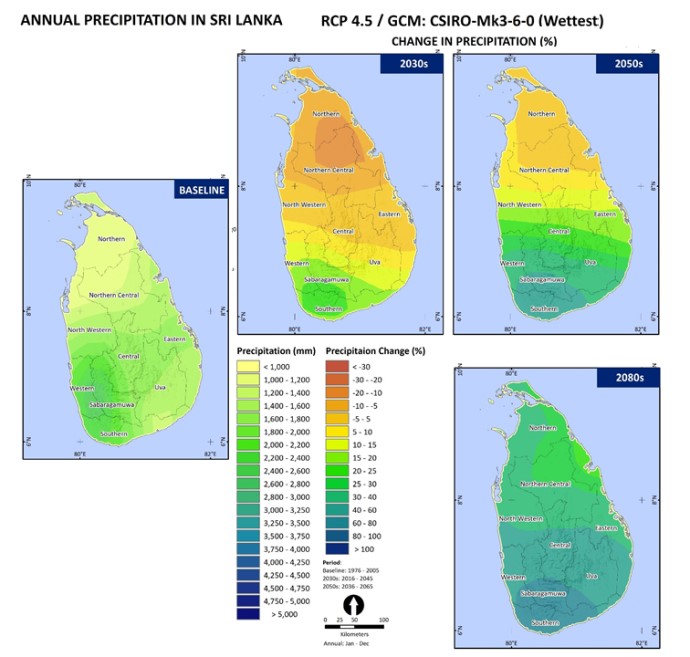
FIGURE 2. Projected Change in annual average precipitation over Sri Lanka for 2030, 2050 and 2080 time period derived from CSIRO-Mk3-6-0 for the RCP4.5 scenario.
2.3 Pilot site selection
A standard randomized sampling technique developed by Deakin University in Australia was employed to select the pilot sites, including flood-affected areas (treatment site) and non-flood affected areas (control site). The project team used an experimental design to conduct the two surveys: one baseline survey and another endline survey in areas affected by climate-induced floods (treatment site) and non-affected areas (control site). Based on historical climate information, the project team identified climate-induced flood hazard regions termed as ‘treatment areas’ and the other part of the country as ‘comparison areas’. Sri Lanka has 25 districts in total, which can be categorized into three zones: wet, intermediate, and dry regions. Based on the previous 25 years of flood history, districts are divided into more-likely-affected-group, which comprise those with more than 4 years of flood incidents and the other group, namely less-likely-affected-group for the districts with less than 4 years of flood experience. Based on this categorization, 11 districts fall into the affected group leaving 14 remaining districts in the non-affected group. The research design randomly chose two potential treatment districts from the affected group and two control districts from the non-affected group. The 2 districts selected for the affected group were from the wet zone as all the 11 affected districts were from the wet zone, while the two districts selected from the control group was one from the wet zone and one from the intermediate zone as the 14 unaffected districts were from all the three zones. The districts from the dry zone were not considered as they had an ancient irrigation system in place to compensate for rainfall deficit. All 4 districts thus had only rainfall dependency for agriculture.
The unit of areas was defined at the polygon level and spatially clustered based on its potential for paddy crop arability along with its level of climate-induced flood hazard risks. The general delineation of polygons into treated and control cohorts was also identified in a similar way. In particular, the following steps were taken in identifying the study area:
- i) Collecting district level historical flood data (affected area and timeline of flood events, number of casualties, and damage and losses);
- ii) Selecting 4 districts in each country and dividing all of the 4 districts into two groups: experiencing floods (treated districts) and never exposed to floods (control districts);
- iii) Collecting the land use/landcover data in GIS format (shapefiles) that includes information such as arable/farmland, type of crops cultivated in each unit of land, etc.
- iv) Overlaying district administrative boundary on the land use map;
- v) Within the list of treated districts (referring to selection criteria ii) in the zone, 2 districts were picked randomly;
- vi) For each of the 2 districts selected as per criterion (v), it was ensured that:
- vi. a) The number of rice plots is equal;
- vi. b) Those rice plots’ total area should sum up to a similar figure even though there could be variations.
- vii) Information was also collected on the characteristics for each of the randomly selected rice plots in criterion (vi) on the size of cultivated land, proximity to water body, forest land, elevation/ruggedness, rainfall and temperature statistics, socio-economic status of the households, and on the whole, paddy-related data.
Another 2 districts were also randomly selected as control districts to meet the criteria as mentioned below:
- i) Two districts were selected as non-flooded districts (control);
- ii) The selection of the rice plots should be such that they resemble approximately the size of the treatment plots;
- iii) The number of selected rice plots for treatment and control is kept equal and considers the geographic, topographic, demographic, economic, and socio-economic attributes the same for all the districts.
Based on the above, 125 rice plots were considered from each district randomly covering both control and treatment groups. Two surveys were carried out (baseline survey and end-line survey) between 2016 to 2017. Based on the number of plots affected, the treatment group included 251 plots affected by floods, while the control group comprised 697 plots that were not affected by floods in any of the two years. Galle and Gampaha were the two affected districts, while Kegalle and Monaragala were the two unaffected districts (Figure 3).
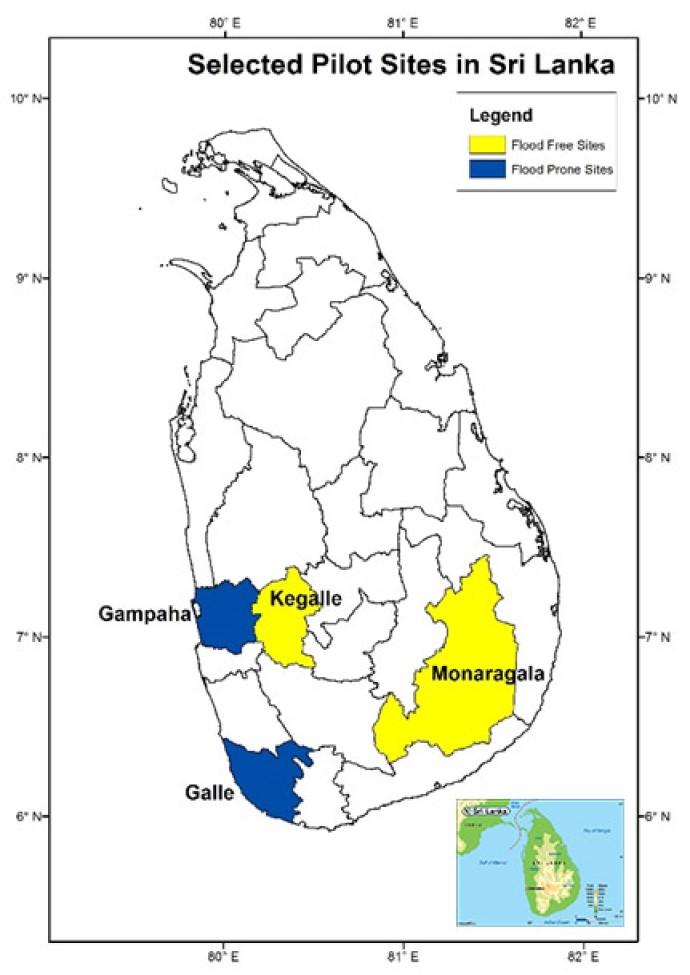
FIGURE 3. Maps showing the pilot sites in Sri Lanka.2.4 Econometric model on loss and damage in the agriculture sector
The econometric model used difference-in-difference (DD) framework (Ashenfelter & Card, 1985; Bertrand et al., 2004; Wing, Simon, & Bello-Gomez, 2018) to evaluate the effect of the flood on crop production (Merz et al., 2010). The DD framework compares the average changes in the outcome variables for the treatment group and the control group before and after flood. The Standard DD equation is as follows:

where subscript I indicates individual (household/plot) and subscript t denotes year. Yit is the outcome of interest of individual I at time t. Our primary outcomes of interest include crop production indicators: crop yield, crop output, and crop area. Treatmentit is an indicator equal to 1 for individuals that belong to the treatment group in year t and 0 otherwise. Aftert is an indicator for timing of the treatment, β is the difference in the outcome between the two periods, before and after floods, the coefficient of interaction between these two variables (Treatmentit and Aftert), γ, measures the effect of floods and ϵit is a composite measurement error.
As districts were chosen randomly, it is likely that several indicators such as paddy yield or coverage area significantly differ between treatment and control plots before floods. To reduce the bias, district fixed effect was introduced in the model modifying the Standard DD equation:

where ad is the district fixed effect. Similarly, we incorporate covariates representing household/plot characteristics and inputs for production function into the model by considering the farmer’s reaction to flood where they may adjust the production inputs to offset the negative effect of floods. Thus, the equation was modified to

where Zit is a set of household/plot characteristics and inputs that are appropriate for each of the outcomes. Thus, for the yield equation, we controlled the household’s endowment, including total land area owned (in log), household size (total household members), crop cultivation period (in months), and fertilizer use (in log). Crop cultivated area is an additional control when the outcome is crop output. For the outcome being crop area, crop output (in log) is added along with the set of controls in the yield equation. A variation of equation 3 is also used when we include flood fixed effect in the model whenever the coefficient of flood-water height or log (flood-water height) is statistically different from zero, suggesting that the two groups are permanently different. The coefficient with flood fixed effect is as follows:

where bf is the coefficient with flood fixed effect. Finally, standard errors are clustered at the household/plot level in our estimation.
3. RESULTS AND DISCUSSION
A number of components were considered for the present study. The flood inundation extent and flood height were measured for each plot using the flood extent map available from the Sri Lankan Disaster Management Department and ASTER GDEM v2. Historical climate data analysis enabled us to select the pilot districts (treatment and control) in the three zones. The future precipitation projection using the NEX-GDDP model shows that these areas are likely to be affected in the future. Thus, the econometric model tested in the project area can effectively be used to estimate loss and damage.
A number of scenarios were considered for loss and damage assessment using the econometric model. The descriptive statistics and the changes in households/plots’ characteristics before and after the flood hazard for treatment plots and control plots are given in Table 1. Farmers were grouped into two (a) group averse to risk-taking and (b) farmers who show a willingness to take risk.
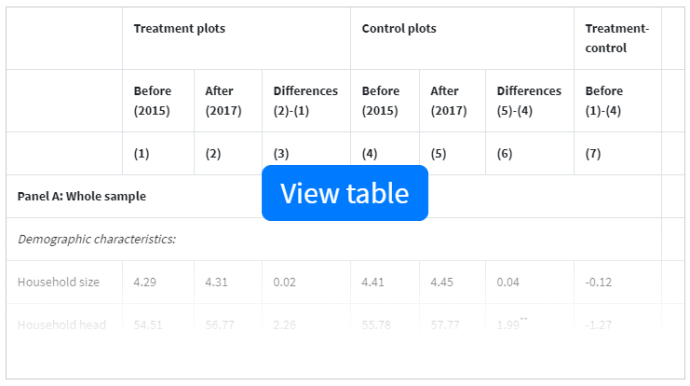
TABLE 1. Descriptive statistics of treatment plots and control plots.
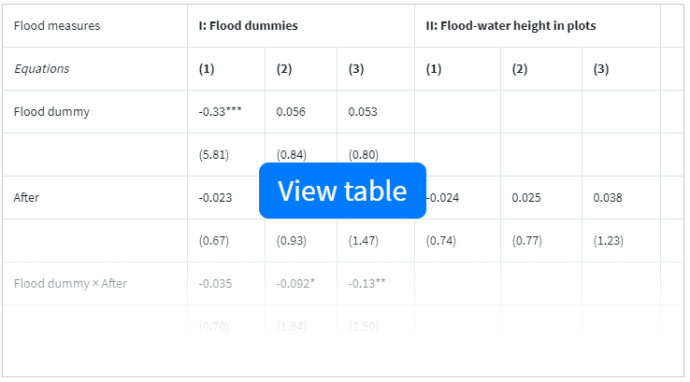
TABLE 2. Effect of floods on paddy yield.
3.1 Effect of the flood on paddy yield (whole sample)
The first model run was for the entire sample, including both groups. The first regression in each block (corresponding to equation 1)) controls for only flood shock variables. In the second regression of each block (corresponding to equation 2), district fixed effect is added to eliminate the variation from permanent differences between control and treatment districts that may bias the estimate. The third regression in each block (corresponding to equation 3)) includes a set of household characteristics and paddy production inputs. It is important to highlight that since the district fixed effect is controlled for all three blocks, there is no difference between the control and treatment groups. It was found that on average if all else is equal, 1 meter of flood-water height in plots causes 2.2% yield loss which is equivalent to a loss of 44,220 kg paddy output for 1 km2 of paddy production area (see Table 2).
3.2 Effect of flood on non-paddy yield
When considering the effect on non-paddy yield, the two groups were considered separately. It was observed that a considerable loss of non-paddy yield of about 84% for farmers averse to risk-taking using our preferred measure of floods (flood-water height in plots). The estimate of yield loss is significant at 5% level for all three flood measures. On the other hand, the loss is around half for the farmers willing to take the risk though yield loss estimate is not significant for all three flood measures. Thus, it can be inferred from our results that farmers who are averse to risk-taking give priority to paddy while cultivating non-paddy crops on riskier plots. Hence, they can avoid yield loss for paddy, which comes at the expense of a large loss for non-paddy crops. On the other hand, farmers willing to take a risk tend to be more open to growing non-paddy crops in less risky plots and paddy crops in riskier plots.
3.3 Effect of flood on paddy and non-paddy production
The study also looked into the production of paddy and non-paddy crop besides the yield. It was found that if the estimate includes all the three conditions, district fixed effect, household characteristics and production inputs and effect of the flood on crop output is evaluated with the assumption that crop production area is kept the same as without flood incidents. The effect of the flood on production output is very similar to the effect on yield function. Flood has a negative and significant effect on both paddy output and non-paddy output in the whole sample. While considering farmers averse to risk-taking, there is no effect on paddy output while it is huge for non-paddy output. In contrast, for farmers willing to take a risk, a large and significant adverse effect on paddy output is observed, while the effect on non-paddy output is large though insignificant.
The present study shows that the flood causes output loss for both paddy and non-paddy crops. Farmers who are reluctant to take risk shoulder the loss of both paddy and non-paddy crop production, while farmers willing to take risk incur the loss of paddy production. They all respond to the loss by expanding production area, with the former pursuing non-paddy production while the latter favouring paddy crop production. On the one hand, though post-flood high soil moisture content is a good pre-condition for cultivating crops, the risk of pest, diseases, and crop failure is more likely to occur due to changes in soil biotic conditions caused by the flood.
Post-disaster damage and loss evaluation is generally carried out using remote sensing data due to wide coverage and shorter temporal resolution. Still, the data used in the studies so far are mainly RADAR data or MODIS Data or Landsat data, which have a very coarse resolution. As a result, the damage and loss can be analyzed up to a certain scale. On the other hand, review of a number of other studies on flood damage to agriculture showed that damage and loss assessments have been carried out to evaluate direct instantaneous, direct induced and indirect damage to agriculture (Br�mond et al., 2013). The analysis of studies by Br�mond et al. (2013) found that damage function of crops need to be improved and vegetative growth stage of crops require consideration as damage to crops and resulting loss are likely to be different at different stages thus influencing the crop damage function. The present methodology is not applicable for post-disaster damage and loss. Rather, it estimates the potential loss and likely damage in the future based on past events. The loss and damage assessment carried out in the present study also took a hybrid approach where flood inundation has been analyzed from satellite sensor data (SRTM), but the potential loss and damage assessment was carried out at the household level based on the exposure of the plot owned by the farmer to flood. The present study is a panel-based statistical approach where the challenge of unobserved omitted variables in identifying a causative relationship between natural disasters and agricultural outcomes are taken care of by using a panel-based dataset. As the data used is at the micro-plot level, it is less likely to be disturbed by other factors allowing for the identification of the true effect of flood damage on production. The present study also looked at the farmers’ behavioural and demographic characteristics as part of the panel data set, which has not been considered in other studies. Uncertainty is an integral part of any model technique. In the DD Framework, the major source of uncertainty is sampling error. The standard randomized sample technique was thus used to reduce the uncertainty in sampling. Additionally, the current study did not consider other agriculture components except the paddy and non-paddy crops.
4. CONCLUSION
Agriculture production largely depends on the weather condition and is extremely prone to natural disasters and hazards. A more frequent and severe occurrence of natural disasters such as storms and floods in recent decades has put food security at an increased risk and undermine farmers’ life satisfaction. Farmers in less developed countries are most vulnerable to natural disasters and hazards due to lack of support from the government and limited resources to overcome the losses. Sri Lanka, a developing country with the majority of the rural population (77.4%) dependent on agriculture, is hit by annual flood with an increase in the affected area in the recent decade. This study investigates the effect of floods on agriculture production and farmers’ response to flood incident using data at the plot level. Our research design applies the removal of potential bias caused by the difference between treatment and control group at the district level, generated a sample equivalent to that from a randomized control trial. This allows us to quantify the causal effect of floods using the DD framework. The research concluded the following: i) The estimate shows a significant loss in paddy yield of 44,000 kg/km2 owning to floods in the studied years; ii) the farmers who are averse to risk-taking give priority to paddy while cultivating non-paddy crops on riskier plots; and iii) in contrast, farmers willing to take a risk, tend to be more open to growing non-paddy crops in less risky plots.
Farmers offset this loss by expanding crop cultivated area utilizing the soaked field after the flood though there are chances of pest attack and disease. The study also shows that historical climate information, plot-level flood-water height estimation using GDEM v2, and flood extent information can be useful as an input to the econometric model to estimate potential loss and damage. The study opens an opportunity for future research on the usage of future precipitation projection information in estimating future floods and using the information to estimate likely loss and damage to enable better adaptation and mitigation measures as well as include other components of the agriculture sector such as livestock, fisheries, etc. As the present model is robust enough to different flood incident measures/intensity, it may also be tested in other flood-prone agriculture dominant economies.
ACKNOWLEDGEMENT
The research was funded by the Asia Pacific Network for Global Change Research (CAF2014-RR01NMY-Basnayake). The authors would like to thank all the participants for providing their time and knowledge during the survey carried out in Sri Lanka. The author would also like to express gratitude to their affiliated organizations for the support in carrying out the research.
REFERENCES
- ADB. (2009). Building climate resilience in the agriculture sector of Asia and the Pacific. Retrieved from https://www.adb.org/sites/default/files/publication/27531/building-climate-resilience-agriculture-sector.pdf
- Ahmed, M., Rahaman, K., Kok, A. & Hassan, Q. (2017). Remote sensing-based quantification of the impact of flash flooding on the rice production: A case study over Northeastern Bangladesh. Sensors, 17(10), 2347. doi:10.3390/s17102347
- Ashenfelter, O., & Card, D. (1985). Using the longitudinal structure of earnings to estimate the effect of training programs. The Review of Economics and Statistics, 67(4), 648. doi:10.2307/1924810
- Bertrand, M., Duflo, E., & Mullainathan, S. (2004). How much should we trust differences-in-differences estimates? The Quarterly Journal of Economics, 119(1), 249–275. doi:10.1162/003355304772839588
- Br�mond, P., Grelot, F., & Agenais, A.-L. (2013). Review article: Economic evaluation of flood damage to agriculture – review and analysis of existing methods. Natural Hazards and Earth System Sciences, 13(10), 2493–2512. doi:10.5194/nhess-13-2493-2013
- Chandrapala, L. (1996). Long term trends of rainfall and temperature in Sri Lanka. In Y. P. Abrol, S. Gadgil, & G. B. Pant (Eds.), Climate Variability and Agriculture (pp. 150-152). New Delhi: Narosa Publishing House.
- Cheng, C. S., Campbell, M., Li, Q., Li, G., Auld, H., Day, N., … & Yap, D. (2007). A synoptic climatological approach to assess climatic impact on air quality in south-central Canada. Part I: Historical analysis. Water, Air, and Soil Pollution, 182(1-4), 131-148. doi: 10.1007/s11270-006-9327-3
- Conforti, P., Markova, G., & Tochkov, D. (2020). FAO’s methodology for damage and loss assessment in agriculture. FAO Statistics Working Paper 19-17. Rome. doi:10.4060/ca6990en
- FAO. (2017). The future of food and agriculture – Trends and challenges. Rome. Retrieved from http://www.fao.org/3/a-i6583e.pdf
- FEMA. (2018). Guidance for flood risk analysis and mapping: Flood depth and analysis grids. Retrieved from https://www.fema.gov/media-library-data/1523562952942-4c54fdae20779bb004857f1915236e6c/Flood_Depth_and_Analysis_Grids_Guidance_Feb_2018.pdf
- Gordon, C., Cooper, C., Senior, C. A., Banks, H., Gregory, J. M., Johns, T. C., … & Wood, R. A. (2000). The simulation of SST, sea ice extents and ocean heat transports in a version of the Hadley Centre coupled model without flux adjustments. Climate dynamics, 16(2-3), 147-168. doi:10.1007/s003820050010
- Islam, M. N., Rafiuddin, M., Ahmed, A. U., & Kolli, R. K. (2008). Calibration of PRECIS in employing future scenarios in Bangladesh. International Journal of Climatology, 28(5), 617–628. doi:10.1002/joc.1559
- IWMI. (2018). Getting ahead of disaster risks. Retrieved from https://www.iwmi.cgiar.org/2018/08/getting-ahead-of-disaster-risks/
- Jayatillake, H. M., Chandrapala, L., Basnayake, B. R. S. B., & Dharmaratne, G. H. P. (2005). Water resources and climate change. In Proceedings of Workshop on Sri Lanka National Water Development Report. Wijesekera, N. TS.
- Jin, C., Xiao, X., Dong, J., Qin, Y., & Wang, Z. (2015). Mapping paddy rice distribution using multi-temporal Landsat imagery in the Sanjiang Plain, northeast China. Frontiers of Earth Science, 10(1), 49–62. doi:10.1007/s11707-015-0518-3
- McKenzie, E., Prasad, B. & Kaloumaira, A. (2005). Economic Impact of Natural Disasters on Development in the Pacific. Research Report, Australian Agency for International Development, 1.
- Marambe, B., Silva, P., & Athauda, S. (2017). Agriculture and rural development under central government and provincial council setup in Sri Lanka. In Decentralization and Development of Sri Lanka Within a Unitary State, 111–145. doi:10.1007/978-981-10-4259-1_6
- Meinshausen, M., Smith, S. J., Calvin, K., Daniel, J. S., Kainuma, M. L. T., Lamarque, J.-F., … van Vuuren, D. P. P. (2011). The RCP greenhouse gas concentrations and their extensions from 1765 to 2300. Climatic Change, 109(1-2), 213–241. doi:10.1007/s10584-011-0156-z
- Merz, B., Kreibich, H., Schwarze, R., & Thieken, A. (2010). Review article “Assessment of economic flood damage”. Natural Hazards and Earth System Sciences, 10(8), 1697–1724. doi:10.5194/nhess-10-1697-2010
- Mirza, M. M. Q. (2011). Climate change, flooding in South Asia and implications. Regional Environmental Change, 11(1), 95-107. doi:10.1007/s10113-010-0184-7
- OML Center. (2017). The links between loss and damage, climate change adaptation, and disaster risk reduction. Briefer. pp16.
- Sekhar, CSC. (2018). Climate change and rice economy in Asia: Implications for trade policy. Rome, FAO. 62 pp. Retrieved from http://www.fao.org/3/CA2207EN/ca2207en.pdf
- Shrestha, R., Di, L., Yu, E. G., Kang, L., Shao, Y., & Bai, Y. (2017). Regression model to estimate flood impact on corn yield using MODIS NDVI and USDA cropland data layer. Journal of Integrative Agriculture, 16(2), 398–407. doi:10.1016/s2095-3119(16)61502-2
- Singha, M., Wu, B., & Zhang, M. (2016). Object-based paddy rice mapping using HJ-1A/B data and temporal features extracted from time series MODIS NDVI data. Sensors, 17(12), 10. doi:10.3390/s17010010
- Stainforth, D. A., Downing, T. E., Washington, R., Lopez, A., & New, M. (2007). Issues in the interpretation of climate model ensembles to inform decisions. Philosophical Transactions of the Royal Society A: Mathematical, Physical and Engineering Sciences, 365(1857), 2163–2177. doi:10.1098/rsta.2007.2073
- Taylor, K. E., Stouffer, R. J., & Meehl, G. A. (2012). An overview of CMIP5 and the experiment design. Bulletin of the American Meteorological Society, 93(4), 485–498. doi:10.1175/bams-d-11-00094.1
- Thomas, V., & L�pez, R. (2015). Global increase in climate-related disasters. Asian Development Bank Economics Working Paper Series, (466). Retrieved from http://hdl.handle.net/11540/5274
- Torbick, N., Chowdhury, D., Salas, W., & Qi, J. (2017). Monitoring rice agriculture across Myanmar using time series Sentinel-1 assisted by Landsat-8 and PALSAR-2. Remote Sensing, 9(2), 119. doi:10.3390/rs9020119
- Wing, C., Simon, K., & Bello-Gomez, R. A. (2018). Designing difference in difference studies: Best practices for public health policy research. Annual Review of Public Health, 39(1), 453–469. doi:10.1146/annurev-publhealth-040617-013507
Yit
YitYit
-